
Affiliate Disclaimer: This post may contain affiliate links. As an affiliate, I may earn a commission if you purchase through my links, at no extra cost to you. Please read our full disclosure for more info.
Most beginner bloggers open their analytics dashboards and immediately feel overwhelmed.
You see dozens of graphs, percentages moving up and down in green and red, and a glossary of terms that feel impossible to decode.
Here is the truth: you only need to understand 3 metrics to track your first 1,000 visitors. Everything else is optional noise.
When you’re trying to build a sustainable traffic engine for your new blog, obsessing over the wrong numbers leads to burnout.
You don’t need a corporate data science degree to see what’s working.
You just need to know exactly where to look, what those numbers actually mean for your blog’s growth, and how to ignore the vanity metrics that don’t pay the bills.
Let’s cut through the clutter and track your first 1,000 visitors the simple way.
What You Will Learn
By the end of this guide, you’ll know exactly how to read your Pinterest analytics without feeling overwhelmed. You’ll learn:
- The only 3 metrics that matter — Impressions, Saves, and Outbound Clicks — and why everything else is optional noise.
- How to navigate the Pinterest analytics dashboard on both desktop and mobile without getting lost in unnecessary data.
- How to diagnose your pin performance using simple patterns that reveal whether your issue is keywords, design, or board mapping.
- How to track your first 1,000 visitors with a realistic week‑by‑week timeline that matches how Pinterest actually distributes content.
- How to compare static vs. video pins fairly using ratios instead of raw numbers.
- How to use AI (Gemini + Copilot) to analyze your data without giving any tool direct access to your account.
- What to do when a pin goes viral so you can turn a spike into long‑term traffic.
- How to build a Save‑First system that grows your traffic on autopilot.
Why Pinterest analytics is different (and why it matters)
If you’ve ever looked at traditional search engine analytics, you need to unlearn a few things. Pinterest ≠ Google Analytics or SEO dashboards. Pinterest is not a social feed but a search engine with delayed distribution.
Pinterest users are planners, not scrollers — which means their actions carry far more intent than typical social media engagement.
On Pinterest, the core behavioral loop is entirely different: impressions + Saves + outbound clicks.
Readers see your pin (impression), they decide it’s valuable enough to keep (Save), and when they are ready to take action, they click through to your blog (outbound click).
Pinterest rewards this loop because Saves signal long‑term usefulness, not fleeting engagement.
This behavioral loop—not algorithmic vanity metrics—is the only thing that drives real, targeted traffic to your site.
By focusing strictly on this loop, you can build an asset that works for you months or even years after you hit publish.
How to access and navigate your Pinterest analytics dashboard
Before you can analyze your numbers, you need to know how to find them. Many beginners get stuck here because Pinterest’s analytics dashboard is split across different menus depending on whether you’re on desktop or mobile.
Navigating your Pinterest analytics dashboard is simple once you know exactly where to look.
Pinterest provides access to your data on both desktop and mobile, but they serve two different purposes in your workflow.
You’ll use desktop for deep analysis and mobile for quick checks, since some metrics and filters only appear on desktop.
Desktop vs. mobile app views
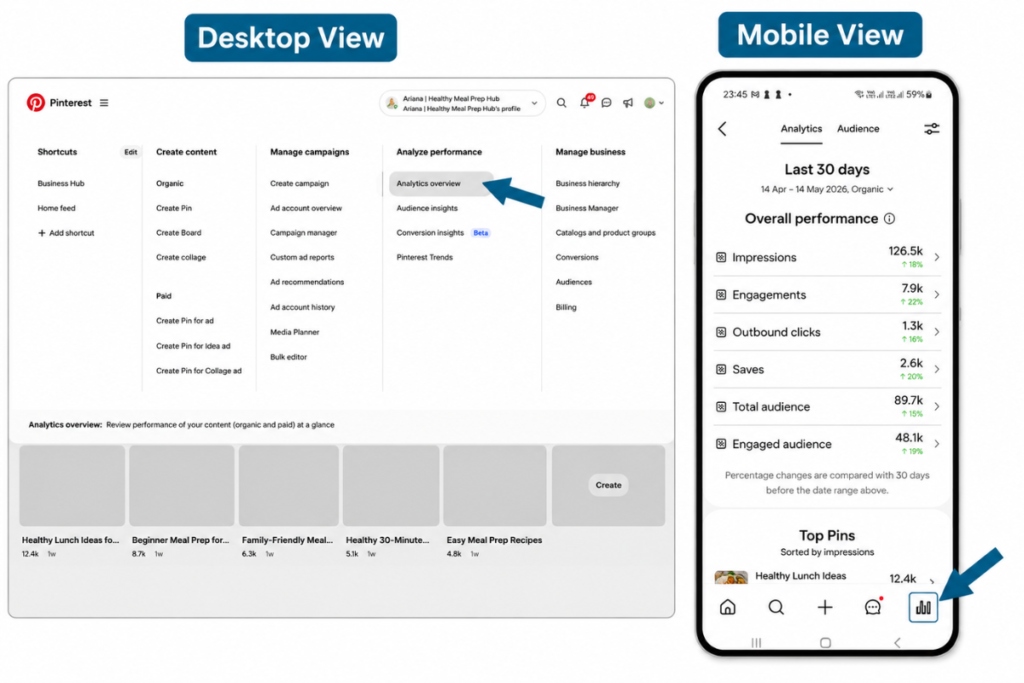
On Desktop (for deep analysis):
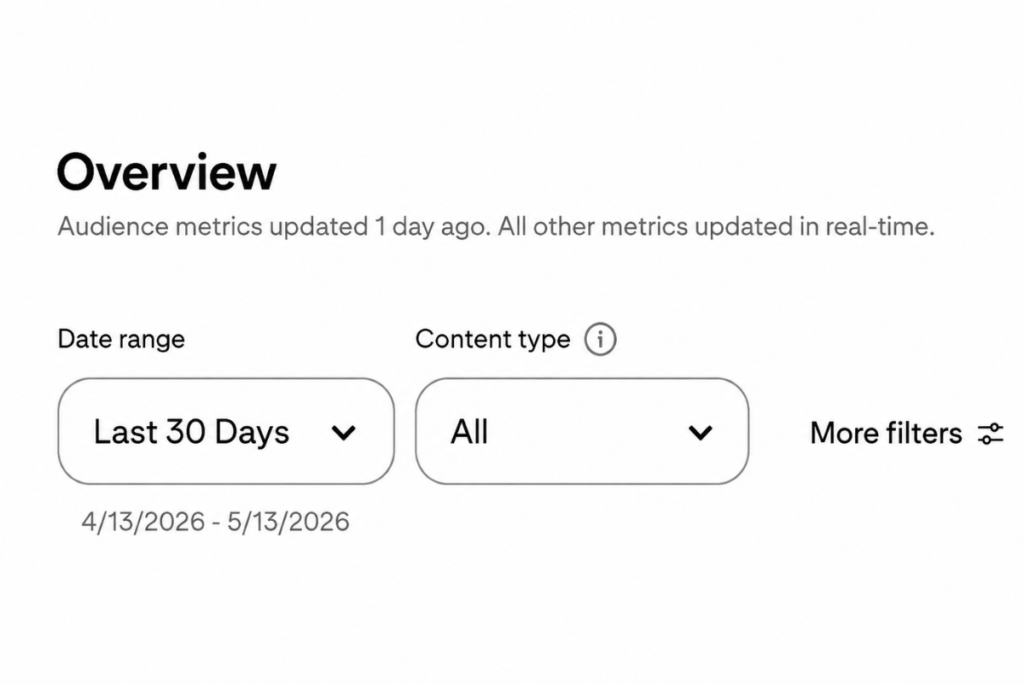
Log into your Pinterest Business account. In the top‑left corner, click Analytics, then select Overview from the dropdown menu.
This is your command center. Here, you can filter by date ranges, view performance across all your pins, and export your data for closer inspection.
Some metrics and filters only appear on desktop, so this is the version you’ll rely on for serious analysis.
On Mobile (for quick checks):
Open the Pinterest app and tap your profile picture in the bottom right.
Tap the Analytics icon (the small bar‑chart symbol). This gives you a streamlined view of your overall performance and your top pins over the last 30 days.
Mobile analytics are simplified and may lag slightly behind desktop, so don’t worry if the numbers don’t match exactly.
The 3 core metrics that actually matter for beginners
When you look at your overview, Pinterest throws a lot of data at you: engagement rate, pin clicks, total audience, etc. Ignore them. Focus exclusively on these three.
Impressions (your discovery rate)
Impressions simply mean the number of times your pin appeared on someone’s screen. If your pin shows up in a user’s home feed, search results, or related pins, it counts as an impression.
Impressions tell you whether Pinterest is distributing your content. They don’t measure performance — they only show that Pinterest is testing your pin in front of real users. Impressions usually grow slowly at first because Pinterest needs time to understand and categorize your content.
If you followed the steps in our guide on How to Find Pinterest Keywords That Actually Drive Traffic (Free Methods), high impressions mean your keywords are working and Pinterest understands what your content is about.
Saves (the ultimate trust signal)
A “Save” (formerly called a repin) happens when a user clicks the red Save button to add your pin to one of their own boards.
This is the most critical metric on the platform.
A Save is a massive trust signal. It tells Pinterest’s algorithm, “This content is highly valuable,” which prompts Pinterest to show your pin to even more people.
High Saves lead to viral distribution because every Save creates a new distribution path and exposes your pin to a fresh audience.
Saves also compound over time — one Save can lead to dozens of new impressions, which can lead to more Saves, creating a snowball effect that keeps your content circulating for months.
Outbound clicks (your actual blog traffic)
An outbound click is exactly what it sounds like: a user clicked your pin and was taken directly to your blog.
This is your bottom line. Impressions and Saves help your content grow on Pinterest, but outbound clicks are what actually put eyes on your website, build your email list, and generate revenue.
Outbound clicks are a lagging metric — they rise only after your Saves begin compounding.
Pinterest’s outbound click numbers may not match your Google Analytics sessions exactly, and that’s normal. Pinterest measures the click on the platform; Google Analytics measures the session on your site.
How these 3 metrics work together
Looking at these metrics in isolation doesn’t tell you much. The real insight comes from the patterns between them.
Pinterest tests your pins in phases — first impressions, then Saves, then clicks — so each metric reveals a different part of the story.
Here are the four quick patterns you need to diagnose your content:
- High impressions + low Saves/clicks → Your distribution is okay (your keywords are working), but your creative or offer is weak. The pin design isn’t grabbing attention. It’s time to revisit Designing Your First Pins: A Beginner’s Guide to Using Canva for Free.
- High Saves + low outbound clicks → You have an inspirational pin with a weak CTA or weak blog preview. People love the idea but don’t feel compelled to click through for the details.
- Low impressions + high Saves/clicks → You have a strong asset that needs more distribution. The few people seeing it love it. Make sure it’s pinned to the most relevant, highly‑optimized boards, as board quality affects impressions.
- Flat everything → You have a publishing, SEO, or board mapping problem. Pinterest doesn’t know who to show the pin to, and no one is searching for it.
These patterns remove the guesswork and show you exactly where to focus your effort.
How to track your first 1,000 visitors (realistic milestones)
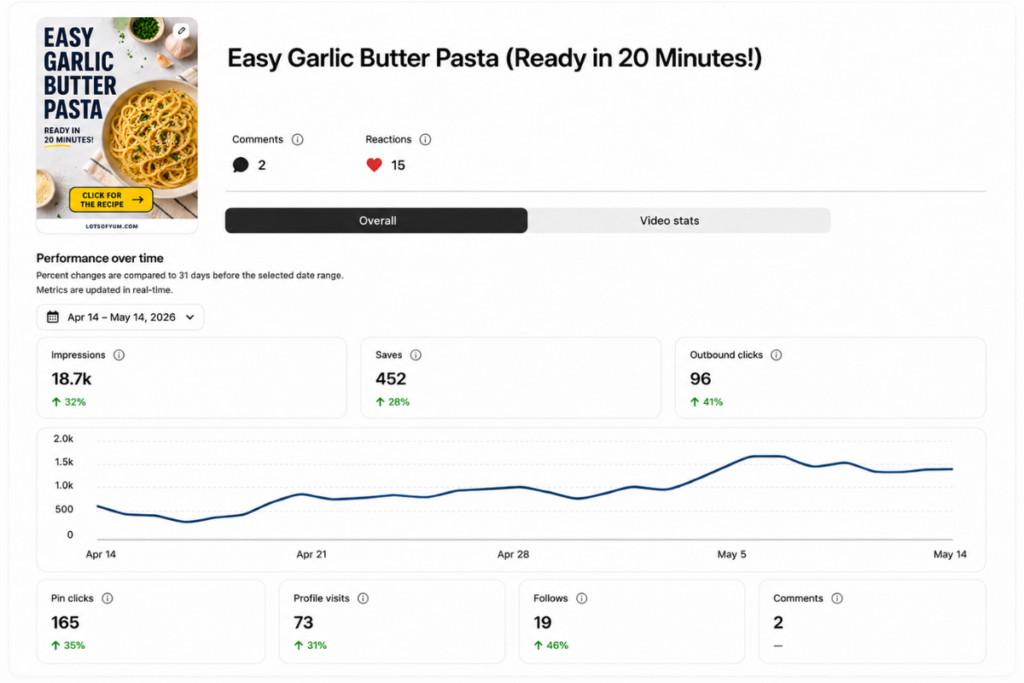
Tracking your first 1,000 visitors requires patience. Pinterest traffic is cumulative, not linear. Pins take time to index and circulate, but they build momentum over months as Saves create new distribution paths that compound over time.
Pinterest tests your content in phases — first impressions, then Saves, then outbound clicks — so your numbers won’t grow at the same pace. That’s normal. Make this timeline‑based, not abstract:
- Week 1–2: Focus on your impressions trend. Are your pins slowly getting more visibility? Don’t worry about clicks yet; you just want to confirm Pinterest is distributing your content.
- Week 3–4: Watch your Saves per 1,000 impressions. Are people starting to bookmark your content? If you have 1,000 impressions and zero Saves, you need to adjust your pin design or messaging.
- Weeks 4–8: Watch for cumulative outbound clicks. This is where the momentum builds. As Saves compound, your outbound clicks will slowly rise toward your first 1,000 visitors.
Explicitly connect: Pinterest shows outbound clicks; your Google Analytics shows how many of those clicks became sessions and what they did next.
The numbers will never match exactly — Pinterest measures the click, Google Analytics measures the session. To make sure your tracking is accurate on your website’s end, check out How to Track Your Traffic (Google Analytics Setup Guide).
Diagnosing your top performing pins and boards
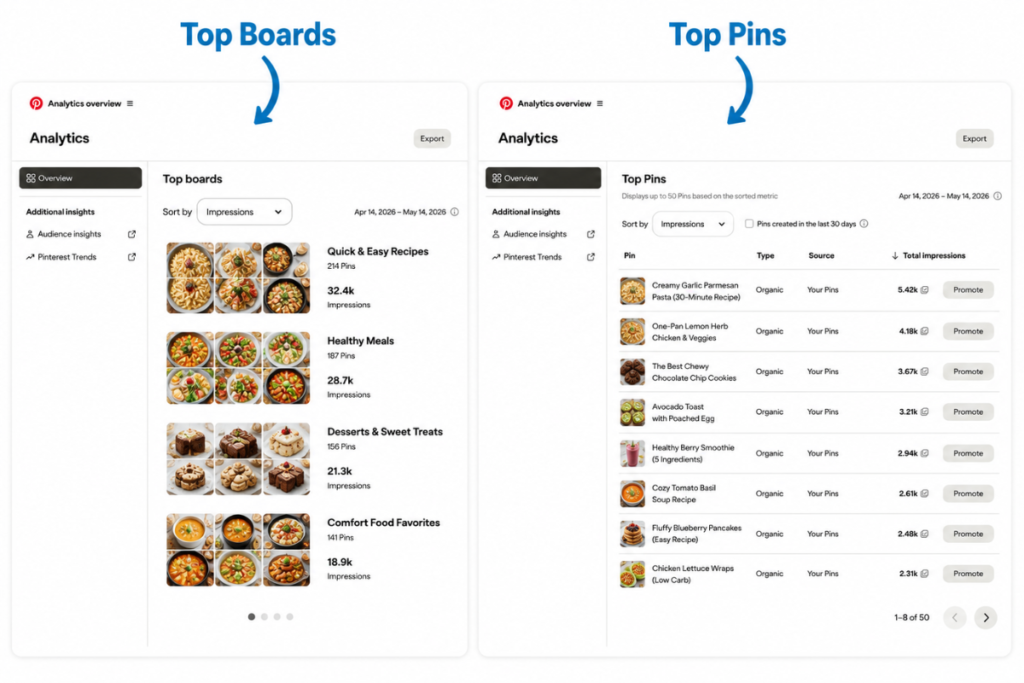
To grow effectively, you need to know why certain pieces of content are working so you can replicate that success. When looking at your top pins, make your analysis metric‑anchored rather than emotional.
For example, if you run a finance blog, compare the outbound clicks on a “beginner debt payoff” pin against its total impressions.
You might find it has low impressions but a massive click‑through rate, which signals high intent from a highly motivated audience.
This tells you the topic is strong — it simply needs more distribution through better board mapping and keyword alignment.
Your goal is to identify patterns you can repeat, not guesswork you can’t scale.
What to do when a pin goes viral
First, let’s define “viral” in beginner terms: a viral pin is simply one that gets 5–10× your normal impressions or Saves.
When this happens, don’t just celebrate — understand that viral pins spike, dip, then stabilize.
Pinterest aggressively tests the pin with new audiences, then settles into a steady distribution pattern once it understands who the pin is for.
Take these 3 actions only:
- Duplicate the angle: Create a new blog post expanding on that exact specific topic. Viral pins reveal demand — follow it.
- Create board‑specific variations: Design 2–3 new pin graphics for the same blog post using slightly different text overlays, and pin them to closely related boards.
- Update the description/CTA: Ensure the pin’s description is fully optimized and the blog post it links to has a strong, clear call‑to‑action (like an email opt‑in).
Evaluating static vs. video pin performance
It’s easy to get caught comparing apples to oranges when you introduce video. Don’t let this become a rabbit hole.
Video pins often get fewer Saves but more impressions because motion captures attention but doesn’t always inspire someone to bookmark the idea.
This is why you must compare formats using ratios, not raw numbers:
- Saves per 1,000 impressions
- Outbound clicks per 1,000 impressions
For example, if you run a wellness blog, compare the Saves per 1,000 impressions between a static “stress‑relief checklist” and a video showing a “20‑minute home workout.” If the static image gets 15 Saves per thousand impressions and the video gets 2, you know exactly which format resonates more emotionally with your audience.
Ratios remove format bias and show you what your audience actually prefers.
🤖 AI Assistance: translating your data into action
Staring at spreadsheets can be intimidating. AI helps you speed up the analysis process, spot patterns instantly, and remove the guesswork — while keeping everything prompt‑driven and under your control.
Always export or copy your own data before using AI tools—never give tools direct access to your accounts.
Using Google Gemini (Lead Partner):
Export your top pins data from Pinterest to a CSV file. Copy the data and paste it into Gemini with this exact prompt:
“Here are my top 30 pins (title + impressions + saves + outbound clicks). Group these by topic and tell me which themes have the highest saves per 1,000 impressions and outbound clicks per 1,000 impressions.”
To help plan your content calendar, use this seasonal prompt:
“Analyze this data and tell me which topics peak during specific seasons so I know when to recreate them next year.”
Using Microsoft Copilot (Support Tasks):
If you need help organizing the raw data in Excel or a spreadsheet before analysis, copy your data and use this prompt in Copilot:
“Sort this CSV by outbound clicks, highest to lowest, and summarize the top 10 pins in one paragraph.”
AI doesn’t replace your judgment — it simply accelerates the parts that used to take hours.
What’s next?
Understanding your analytics is the only way to confirm that your content is actually reaching the people who need it. It removes the emotion from blogging and grounds your decisions in data.
Now that you know how to read your numbers, the next step is designing a system that feeds those metrics on autopilot.
Next up, we’ll cover exactly how to do that in
The Save-First Strategy: Building a Traffic Asset That Lasts.
If you want a complete, proven roadmap to turn this analytical foundation into consistent traffic and revenue,
Sophia Lee’s Beginner Blogging Course shows you the system built entirely on the Save‑First philosophy to help beginner bloggers earn income in their first year.